Content
Objective
This article explains how data needs to be collected when there are problems with Brocade SANnav Management Portal (SANnav) Software.
Environment
Brocade SANnav Management Portal (SANnav) 2.1.x and 2.2.x or later
Procedure
There are different ways to collect data:
- If you have an issue with SANnav and Brocade switch(es) you need the SANnav Management Portal Support Data Collection + technical SupportSave from affected/involved switch(es).
- If there is an issue with the SANnav server you need to collect the SANnav Management Portal Support Data Collection which could be done via browser (preferred method) or command line.
- In this article we only describe how the SANnav server Support Data gets collected. It is also useful to collect a switch SupportSave that is related to the issue (Brocade Data Collection). It is also helpful to note if there is any time difference between the server time and the switch time.
NOTE: Without a timeline and/or screenshots of the events it is nearly impossible to review the data. Ensure that you open a case based on the serial number of SANnav Management Portal server instead of a switch serial number.
Collect SANnav Management Portal server Support Data Collection via browser
- Login to the SANnav Management Portal login window via your browser
Use the IP address or fully qualified domain name (FQDN) of the SANnav Management Portal server - Go to the menu SANnav in the navigation bar, and then select Services > SANnav Support Data Collection

-
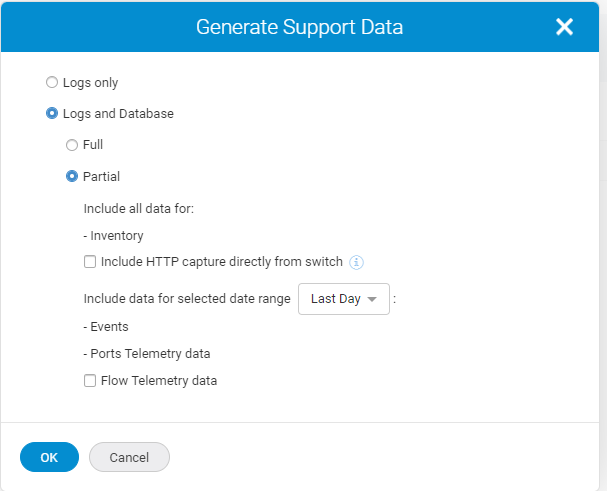
The Generate Support Data dialog will be display after select Actions -> Generate
Brocade SANnav Management Portal 2.2.x
Brocade SANnav Management Portal 2.1.x
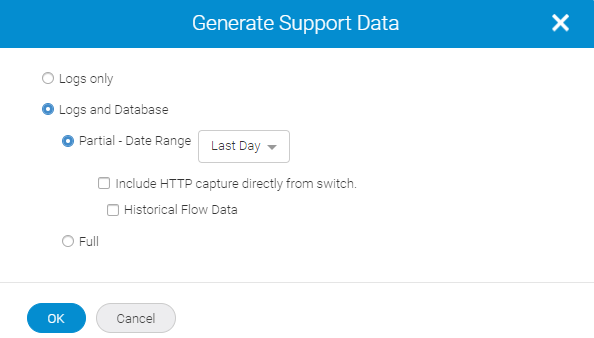
- Select Logs only when you initial open a case.

Otherwise select Logs and Database -> Full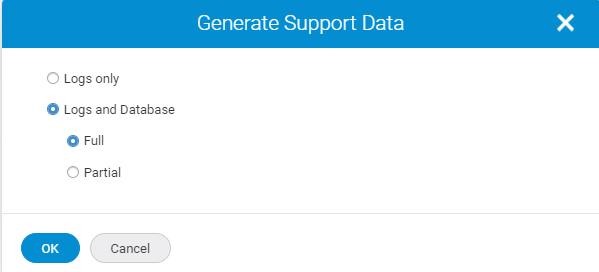
- The process will start after select OK
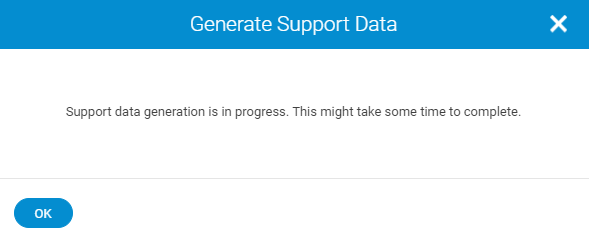
- Collecting support data takes some time, and may times few hours. The files generated are listed under Generated Support Data Files in the
SANnav Support Data Collection page. You may need to refresh the browser to see the newly generated collection
Note
For SANnav Management Portal 2.1.x the Generate button is in a disabled state while support data is being collected.
For SANnav Management Portal 2.2.x if you attempt another Generate following screen will be displayed
- Download the Support Data Collection once the process is ready and the file is displayed at Services > SANnav Support Data Collection -> Generated Support Data Files
Ensure you select a browser download location with sufficient disk space as the file could be multiple GB.
Note
SANnav offers scripts for splitting up and merging it back the support data collection file via command line only.
Instructions are documented at BROCADE® SANNAV™ MANAGEMENT PORTAL USER GUIDE, 2.2.0X
Brocade SANnav Management Portal 2.2.x
Brocade SANnav Management Portal 2.1.x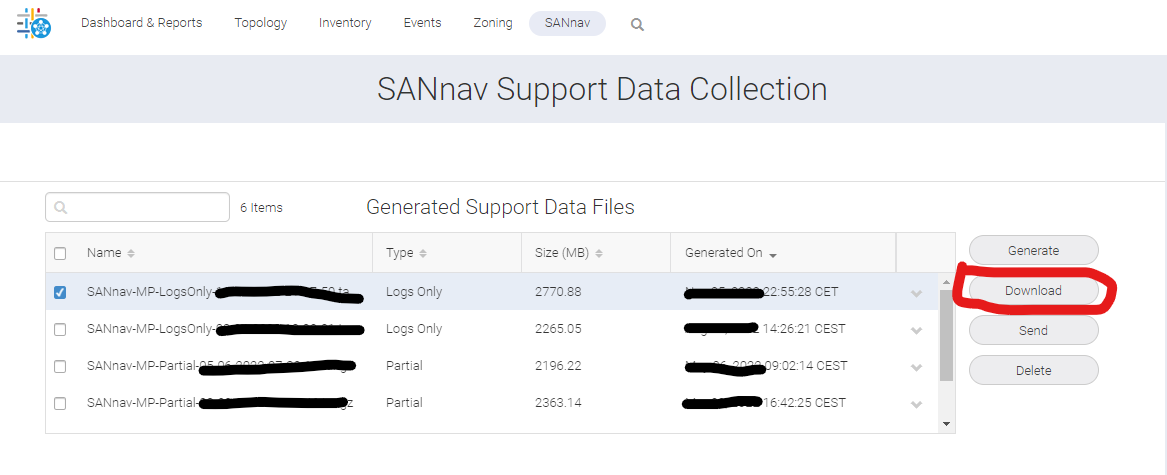
- Upload the files to the Hitachi Global Support Center’s Technical Upload Facility found here:
How to Upload Files to TUF
Note
Hitachi Global Support Center’s Technical Upload Facility offers instructions for large files uploads
Contact the Global Support Center by phone after your upload if your data analysis is urgent!
Additional Notes
- How to collect SANNAV SupportSave from CLI on v2.1.1
- How to generate the SANnav Support Data from the command line interface (CLI)
- What Are the Different Types of Supportsave Data
- BROCADE® SANNAV™ MANAGEMENT PORTAL USER GUIDE, 2.2.0X
- How to Upload Files to TUF
- TUF Split File Utility
CXone Metadata
sannav,SANnav SupportSave,SanNav Log,SANnav 2.1.1,SANnav serial number,SANnav Management Portal,Support Data Collection
PageID: 165277

