Content
Objective
Collect Performance Data from an AMS2000 series or HUS100 Series
Environment
- Adaptable Modular Storage 2000 (AMS2000), DF800
- Unified Storage (HUS / HUS 100), DF850
- Storage Navigator Modular 2 (SNM2) - GUI
- Midrange (DF) Performance Data Collection
Procedure
Prerequisites
- Performance Data must be collected while the problem is happening, for Global Support to see the problem in the logs.
- Performance Data should not exceed 120 collections unless Global Support specifies otherwise.
- Do not change the performance collection interval to anything other than one-minute unless Global Support specifies otherwise. Larger intervals reduce the granularity of the collection data and average out problem areas.
Steps
- Log into SNM2.
- Log into your affected array.
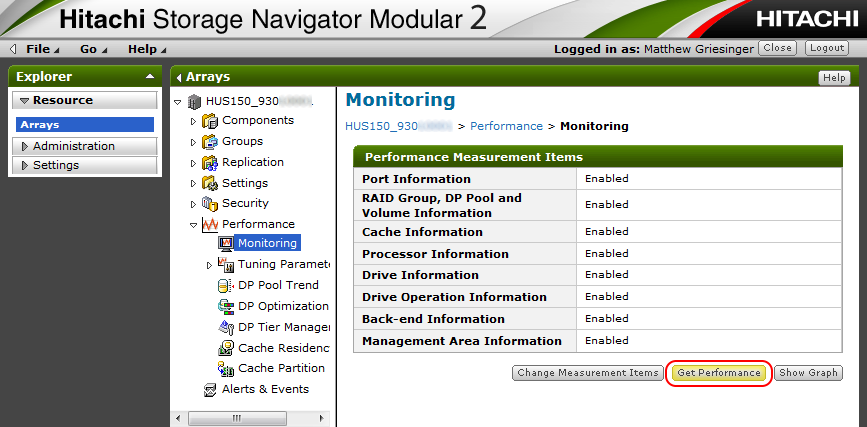
- Click "Performance".
- Click "Monitoring".
- Validate all "Performance Measurement Items" are "Enabled".
- If anything is "Disabled", please see Enabling Performance Monitor for Midrange Arrays Through SNM2 GUI.
- Click "Get Performance" button.

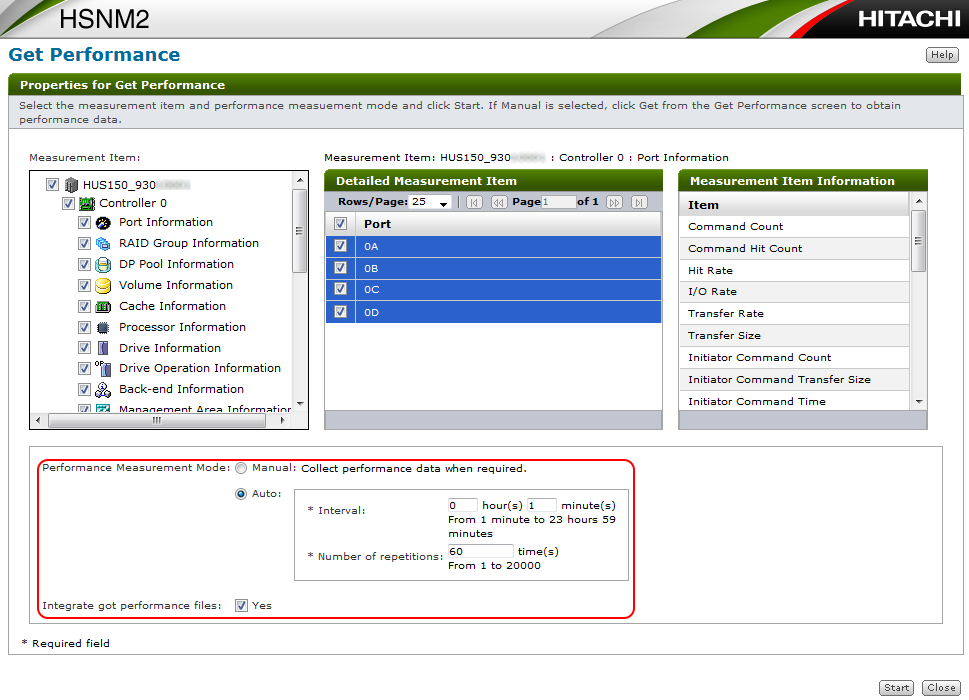
- In the "Measurement Item" box, make sure everything is selected.
- Next to "Performance Measurement Mode" check "Auto".
- Make sure "Interval" is set to "1" unless Global Support has specified otherwise.
- The recommended "Number of repetitions" is "60". Do not exceed "120" unless Global Support has specified otherwise.
- Check "Yes" next to "Integrate got performance files".
- Click "Start" button.

- Wait until performance collection completes before clicking anything else in SNM2! Clicking around may cancel your performance collection.
- When the performance collection is complete, click "Get Files" button and save performance data to desired directory.

- Once Performance Collection is completed, collect a Simple Trace.
- A Simple Trace needs to be collected after the performance collection is completed. This allows Global Support to compare the hardware logs to the performance graphs.
- Collecting a Simple Trace during the performance collection can skew the results.
- Upload the Simple Trace and Performance Data to TUF and Contact Global Support when the upload is completed.
Additional Notes
- Unlike our Enterprise Performance Monitor, the Midrange Performance Monitor cannot look back in time for performance problems.
- GSC does not recommend long term attempts to "find" performance problems using the midrange performance tool. The recommended maximum for long term performance monitoring is 2 hours at one minute intervals (120 collections). Please try to narrow the time of your performance problem BEFORE running the tool.
- If a long-term collection is needed to catch an intermittent problem, please follow DF Performance Data Collection - SNM2 CLI. When uploading the data, the exact start and stop date and time will need to be specified so Global Support's analysis can focus on those areas.
- Running the midrange performance monitor can cause a performance impact in itself if a system is already near its performance limit.
- If an error occurs during SNM2 GUI Performance collection, where there is no "Get Files" screen, or if the "Get Files" window is accidently closed, the files may still exist on the SNM2 server. See How to Find Performance Files on the SNM2 GUI Server.
- Best Practice when uploading files to TUF:
- Do not Archive/Zip the simple trace files. Make sure the files contain *smpl_trc*.dat otherwise Global Support's auto extraction tools will skip it, slowing down analysis.
- It is critical that the trace files containing *0S* or *0E* are uploaded, as these are the files with the array configuration information.
- Make sure the file name contains *pfm*.zip. It is helpful if the serial number is added to the filename, so Global Support can tell which file is from which array if multiple arrays are uploaded.
- Example: 93000000_pfm2.zip
- * is a wildcard for the above examples.
- Do not Archive/Zip the simple trace files. Make sure the files contain *smpl_trc*.dat otherwise Global Support's auto extraction tools will skip it, slowing down analysis.
Other Collection Scenarios
Reminder: Midrange Performance Data needs to be collected while the problem is happening!
- If the Problem Involves the Midrange Array Being Externalized Behind an Enterprise Array, the Collection Procedure Would Be (Sequentially):
- Validate Network Time Protocol is Setup for Midrange Array, Collection Server, and Enterprise Array
- Collect Performance Data from Midrange Array
- Collect Simple Trace from Midrange Array
- Collect Performance Data from Enterprise Array
- Collect Detailed DUMP from Enterprise Array
- If the Problem Involves HNAS Connected to the Midrange Array, the Collection Procedure Would Be:
- Validate Network Time Protocol is Setup for Midrange Array, Collection Server, and HNAS
- Start the Performance Collection from the Midrange Array
- While the Performance Collection is running on the Midrange Array, start the PIR on the HNAS. They must overlap.
- When the Performance Collection is complete for the Midrange Array, collect a Simple Trace
- When the Performance Collection is complete for the HNAS, collect Diagnostics
- If the Problem Involves HNAS Connected to an Enterprise Array With a Midrange Array Being Virtualized, the Collection Procedure Would Be:
- Validate Network Time Protocol is Setup for Midrange Array, Collection Server, HNAS, and Enterprise Array
- Start the Performance Collection from the Midrange Array
- While the Performance Collection is running on the Midrange Array, start the PIR on the HNAS. They must overlap.
- When the Performance Collection is Complete for the Midrange Array and HNAS, collect a Performance Data from the Enterprise array.
- When the Performance Data is Complete for the Enterprise Array, collect the following Hardware logs:
- Detailed DUMP from Enterprise Array:
- FD Dump Tool: How to Download Dump Files Using the FD Dump Tool, or
- Remote Ops (Hi-Track) SVP Agent: How to Collect a Dump Using Remote Ops (Hi-Track) SVP Agent Version C6 or Higher
- Simple Trace From Midrange Array: DF Hardware Data Collection
- Diagnostics From HNAS: Hitachi NAS (HNAS) Platform Data Collection
- Detailed DUMP from Enterprise Array:

