
Content
Objective
Process data collection for Hitach Ops Center Protector using diagdata or GUI.
Depending on type of problem different log collection procedures can be used.
A, B or C outlined below.
Environment
- Hitachi Ops Center Protector
Procedure
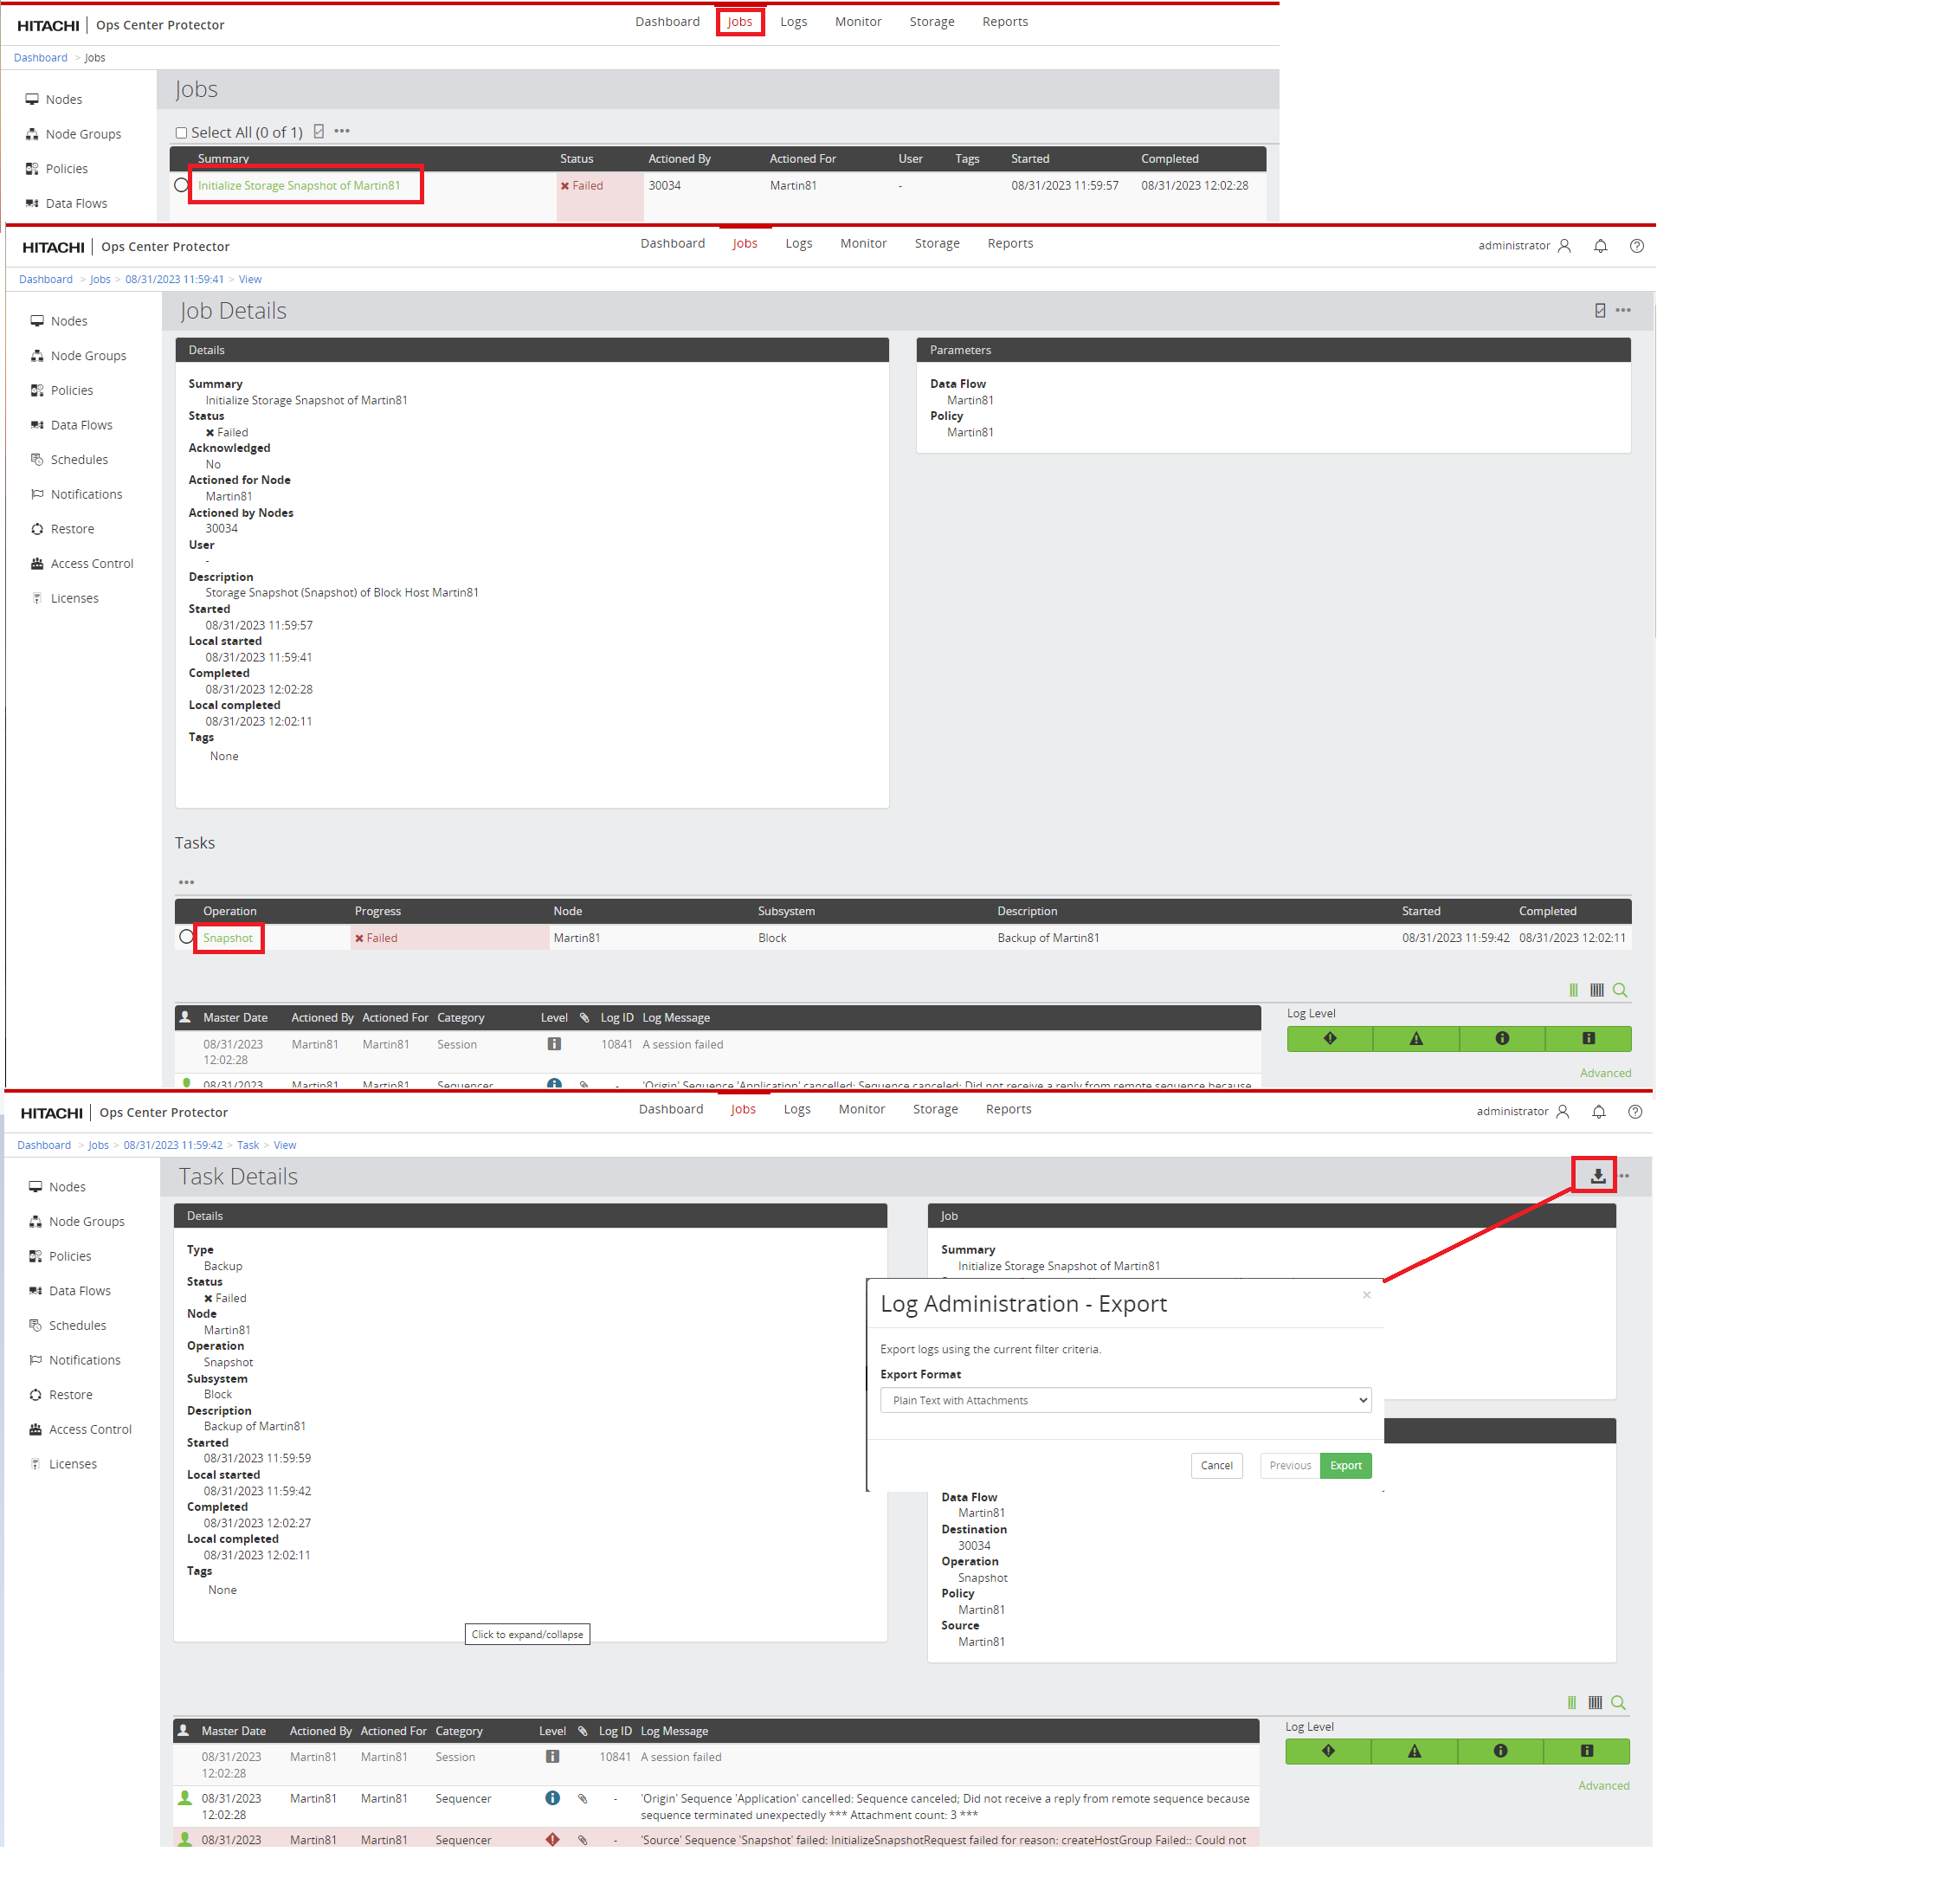
A. Collecting logs using Protector GUI.
Protector job failures, ie Creating snapshot or replication pair failure, job in progress.
Please note that further log collections may be required.
Click the job.
Click Operation under Tasks section.
Export logs from the GUI, upper right corner, select plain text with attachments.
Attach or upload the exported logs to your case.
B. Collecting logs using diagdata CLI command.
Root cause analysis.
Please note that further log collections may be required.
Execute diagdata command on each node.
/opt/hitachi/protector/bin/diagdata -m
Logs collected using diagdata CLI command will be stored in:
/opt/hitachi/protector/runtime/diag*.zip
Upload diag*.zip
C. Collecting logs using diagdata CLI command with tracedebug.
Can be used if you are able to recreate the problem.
Ensure to set trace level back to tracealways otherwise you risk running out of space due to excessive logging.
| Enable tracedebug for Client nodes (ISM) | If advised by Hitachi support same procedure may be used for the Master node. |
| 1. /opt/hitachi/protector/bin/diagdata --stop all | Not required, but may help with the troubleshooting, and will free up more space when step 2 is executed. |
| 2. /opt/hitachi/protector/bin/diagdata -p | Purge existing logs to free up space. If application is running you may receive warning some files could not be deleted, this is expected. |
| 3. /opt/hitachi/protector/bin/diagdata -t tracedebug | Increase the trace level. |
| Do you also want to change the trace level for processes already running? [Y/n]: Y | When this message appears. Respond Y. |
| 4. /opt/hitachi/protector/bin/diagdata --start all | Not required if Protector was not stopped in step 1. |
| 5. Recreate the problem. | |
| Reset trace level and collect logs for Client nodes (ISM) | |
| 6. /opt/hitachi/protector/bin/diagdata -t tracealways | Set trace level back to tracealways. |
| Do you also want to change the trace level for processes already running? [Y/n]: Y | When this message appears. Respond Y. |
| 7. /opt/hitachi/protector/bin/diagdata -f | Export logs. Logs will be stored in /opt/hitachi/protector/runtime/diag*.zip. |
| 8. /opt/hitachi/protector/bin/diagdata --stop all | Not required, but will free up more space when step 8 is executed. |
| 9. /opt/hitachi/protector/bin/diagdata -p | Purge existing logs to free up space. If application is running you may receive warning some files could not be deleted, this is expected. |
| 10. /opt/hitachi/protector/bin/diagdata --start all | Not required if Protector was not stopped in step 7. |
| Collect logs from Master node. | |
| 11. /opt/hitachi/protector/bin/diagdata --stop all | It is recommended to stop the Protector Master when collecting the logs to ensure logs are consistent. |
| 12. /opt/hitachi/protector/bin/diagdata -m | |
| 13. /opt/hitachi/protector/bin/diagdata --start all | Start Protector Master |
Logs collected using diagdata command will be stored in:
/opt/hitachi/protector/runtime/diag*.zip
Upload diag*.zip
When diag*.zip is uploaded, delete the files /opt/hitachi/protector/runtime/diag_*.*
Additional Notes
Commands outlined in the procedures refer to the default installation path on Linux hosts. Adjust to your environment.
If your environment was installed before product name change (HDID -> Protector), installation directory is HDID instead of Protector.
Linux environment:
If you cd into the /opt/hitachi/protector/bin directory, execute command using ./diagdata
Windows environment:
Default installation path:
C:\Program Files\Hitachi\Protector
Commands outlined in the procedures are the same for Windows and Linux but path should be adjusted.
Use Administrator command prompt.
Logs collected using diagdata CLI command will be stored in:
/opt/hitachi/protector/runtime
[root@host]# ls -l /opt/hitachi/protector/runtime/diag*.zip
-rw-r--r--. 1 root root 15815601 Jun 2 2022 /opt/hitachi/protector/runtime/diag_host_20220602123100_M.zip
CXOne Metadata
Tags: Log Collection,diagdata,protector,Hitachi Ops Center Protector,Hitachi Ops Center
PageID: 171148