
Content
HDID Support Manager
Available for HDID versions 5.2 and later
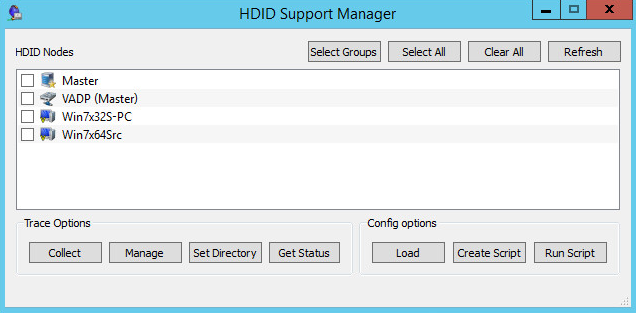
From the HDID Master navigate to the <installation path>\bin directory and execute HDIDsupportmanager.exe
From this support tool we can do many things including setting trace on all nodes and collecting the trace to one central point.
Data collection for issues that aren't easily repeatable
Select each node that presents the issue. Always include the Master and the Source node. If the source node uses a proxy (Proxy shown in brackets after the node name) then it will be the Proxy that is used for any changes/trace collection through the support tool.
Click the "Collect" button and click "OK" again in order to collect the full diagdata trace and then confirm the nodes selected by clicking "OK" again, and the trace collection will begin.
Once complete, the diagdata ZIP files will have been collected from each node and can be found in the <HDID installation path>\runtime\remote trace collection<date>\ directory. Upload these files to TUF.
The trace collected will only be limited to basic information, so it's now best to change the trace to be traceDebug in the hope that the issue will occur again, and we can then collect the trace at this increased level of detail.
To do this, in the support management tool, select the same nodes, click "Manage", tick to "Set Trace Level" and select "TraceDebug" from the list, as shown in the image below:
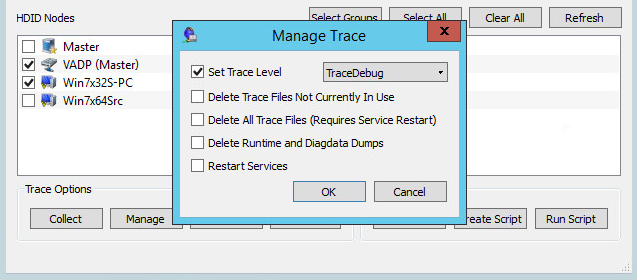
Tick to select to "Restart Services" if required. This will need to be done to pick up the new trace level for any process that is persistent, such as replications using live movers not batch. If this is not done, then the trace will be collected at traceAlways level, which will not gather the information required.
Click OK and OK again to confirm the nodes selected. The trace level will be set on all nodes and services restarted if that option was selected. NB Restarting the services will force the UI to close including the Support Manager tool if you choose to restart the services on the Master. Other nodes will temporarily show the nodes offline until the services have fully started again.
If the problem occurs again, then data collection can be completed and loaded to TUF for HDID Engineering to investigate.
Data collection for repeatable issues
From the Support Management Tool, select each node that presents the issue. Always include the Master and the Source node. If the source node uses a proxy (Proxy shown in brackets after the node name) then it will be the Proxy that is used for any changes/trace collection through the support tool.
Set the trace level to traceDebug.
To do this, select the nodes associated with the problem, click "Manage", tick to "Set Trace Level" and select "TraceDebug" from the list.
Tick to select "Restart Services" if required. This will need to be done to pick up the new trace level for any process that is persistent, such as replications using live movers not batch. If this is not done, then the trace will be collected at "traceAlways" level, which will not gather the information required.
Click OK and OK again to confirm the nodes selected. The trace level will be set on all nodes and services restarted if that option was selected. NB Restarting the services will force the UI to close including the Support Manager tool if you choose to restart the services on the Master. Other nodes will temporarily show the nodes offline until the services have fully started again.
Once the trace level is set appropriately, recreate the issue then gather the trace from all nodes using the Support Management Tool and then upload to TUF for investigation by HDID Engineering.
Change the trace level back to "traceAlways" so as not to continually gather a high level of trace, which will use up disk space.
Gathering trace for nodes that show as offline and are not contactable by the Master
For any node that is showing as offline and not contactable therefore by the Master trace can only be gathered by accessing that individual node.
On the problem node, check that the services are running. To do this, open (as an Administrator) a command prompt at <HDID installation path>\bin and execute the following command:
diagdata --query If the HDID.exe is not showing as a running process, then execute this command:
diagdata --start all Check the services remain started by running diagdata --query command again.
Restarting the services may resolve the issue. If not, then recreate the issue as per the instructions above.
If the services do not remain started, change the "traceLevel" by executing this command:
diagdata -t traceDebug Then try to start the services using this command:
diagdata --start all Then gather trace by running:
diagdata -f The diagdata.zip file can be found in the <HDID installation path>\runtime folder and should be uploaded to TUF for HDID Engineering to investigate.
Guidelines for selecting nodes for data collection
- Backup or Resynchronization issues: Master, Source and Repository nodes are all required.
- Mirror/Replication issues: Master, Source and Destination nodes are all required.
- Hardware Orchestration issues: Master node, and ISM are required.
CXOne Metadata
Tags: Cofio, HDID Data Collection, AIMSTOR
PageID: 11861