Content
Objective
- Simple Trace Collection for AMS/WMS (End of Service Life), AMS 2000, and HUS 100 Series
- Midrange Hardware Data Collection
- Collect Hardware and Configuration Data From a Modular Storage Array
- Gather Storage Hardware Logs for DF Series
Environment
- Adaptable Modular Storage 2000 (AMS2000), DF800
- AMS2100
- AMS2300
- AMS2500
- Unified Storage (HUS / HUS100), DF850
- HUS110
- HUS130
- HUS150
- Midrange / Modular / DF Array
- Simple Trace
- Controller (CTL)
- Web Console
- TCP/80: http://ip-address-of-controller/
- TCP/443: https://ip-address-of-controller/
Procedure
Prerequisites
Note: No username or password is required to collect logs from the array.
Note: Simple Traces may contain multiple parts/files, Global Support needs all the parts for an accurate analysis.
Note: If Performance Data is being collected, Simple Traces must be collected AFTER the performance collection is complete. Do not collect the simple trace before the performance collection (otherwise we cannot compare hardware logs with performance graphs) and do not collect the simple trace while the performance data is running (it will skew the collection).
- Log in to Web Console using the IP address from either CTL0 or CTL1 in a Web Browser (IE, Firefox, Chrome, etc)
- You can either use HTTP (TCP/80) or HTTPS (TCP/443) to access Web Console
- Popup Blockers may need to be disabled for the CTL IP addresses
- Note the Subsystem Status on the main page (is it "Ready", "Warning", or "Alarm"?)
Simple Trace
Remember: The Simple Trace does not contain enough information to diagnose performance problems! If you have host disconnects, LUN access issues, or latency problems, collect Performance Data first!
-
Click the "Simple Trace" Link on the left pane

-
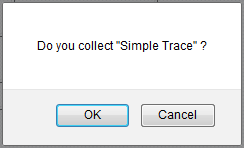
Select "OK" for popup "Do you collect "Simple Trace"?"

-
A window containing Progress percentage with Estimated time left will popup
-
Click the "Download" button when prompted

-
Save the Simple Trace to a desired location. Do not proceed until the Simple Trace file is completely downloaded! The Simple Trace will be corrupted if the process is continued before the previous file is completely downloaded!
-
If there there is only a single file in the Simple Trace (least likely), the Simple Trace file will end in "...0E.dat" and the following window will popup:

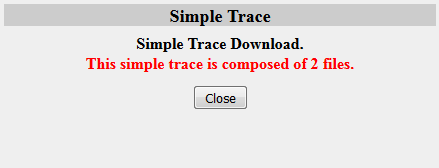
- Notice, it specified there was only 1 file.
- If there is only a single Simple Trace file, click "Close" and Upload to TUF. This is the end of this section.
-
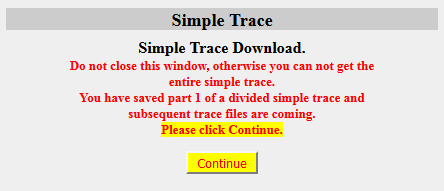
If there is going to be multiple files of the Simple Trace (most likely), the Simple Trace file will end in "...0S.dat" and the following window will popup:

-
If there is multiple files in the Simple Trace, first verify the first file has been completely downloaded before clicking "Continue", otherwise the Simple Trace will be corrupted.
-
-
-
Continue to download each trace file until the file ends in "...#E.dat" (Note: # will be a numerical value indicating how many trace files exist starting from 0). The following popup will also indicate the last trace file was downloaded and how many files there were in the Simple Trace:

-
It is important that between each trace file downloaded, the "Continue" button is not pressed until the previous file is fully downloaded.
-
For more information about the multiple file trace click here.
-
-
Click "Close" and upload all files of the Simple Trace to TUF.
-
It is strongly recommended that the simple trace is not renamed nor Zipped/Archived, otherwise Global Support auto extraction tools will not process it and analysis will be delayed.
-
Warning Information/Information Message
Note: This section is optional, but can greatly speed up analysis when the array is in Warning or Alarm LED is lit on the front bezel or is the displayed status on the main page of Web Console (see step 2). It is also faster than a Simple Trace, and can be uploaded to TUF while waiting for the Simple Trace to complete.
- Click "Warning Information/ Information Message" on the left pane of Web Console
- Take a screenshot of the entire page to show why the array is in its current Warning or Alarm status.

- Upload to TUF. You do not need to wait for the Simple Trace to complete before uploading the screenshot.
CTL Alarm Trace
Note: This only needs to be collected when the array status is in Alarm, or if the array is in Warning and there was a CTL failure. This log compliments the Simple Trace, it does not replace it. A Simple Trace is required and if available, a CTL Alarm Trace can shed light on areas the Simple Trace may not have captured. A CTL Alarm Trace is not always available, if there is no option to download a CTL Alarm Trace, skip this section.
- Click "CTL Alarm Trace" on left pane
- If a CTL Alarm Trace Exists, validate the date and time of the log by comparing it to the current date and time on the upper right of the frame.
- If the date and time listed in the "Information" box is older than the "event" date and time, or much older than the current system date and time, the log does not need to be downloaded, as it is most likely for a previous event.

- If a CTL Alarm Trace is relevant, click the "Download" button and save it to the desired directory.
- Once fully downloaded, Upload to TUF.
Additional Notes
Simple Trace Limitations
A "Simple Trace" is needed for all issues relating to Midrange Storage subsystems (AMS/WMS, AMS2000, and HUS100 series). The Simple Trace contains hardware logs and configuration information. The Simple should be obtained by the Customer (Global Support can obtain one by request if Remote Ops (Hi-Track) Monitor v7.7 or greater is installed). It is critical to gather a trace as soon as possible after a problem is detected. This is to prevent log data wrapping and loss of critical information.
If a performance problem is being experienced, collect Performance (PFM) Data while the problem is happening, and when performance collection is complete then take a Simple Trace. A Simple Trace by itself is not enough to diagnose performance problems, performance data is required for performance problems and must be collected while the problem is happening.
Do not collect the Simple Trace while the PFM data is being collected. Collecting a Simple Trace during PFM data collection will have an adverse effect on the PFM results. If the simple Trace is collected before the performance data, Global Support will not be able to compare the performance graphs with the hardware logs.
If you have host disconnects, LUN access issues, or latency problems, collect Performance Data first!
Multiple File Traces
The Simple Trace starting with AMS2000 code 0890/A and all HUS code may be broken into multiple parts. If the trace is a single file it will have the sequence "0E" in it. If the trace is two files, the first file will contain "0S" and the end file will contain "1E ". If the trace is broken into more than two files, the first file will contain the letter "S", files in the center will contain the letter "C", and the end file will contain the letter "E". Please be sure to upload all files for quick and accurate diagnoses.
Single File Trace

Trace with Two Files

Trace with Three or more Files

Remote Ops (Hi-Track) Monitor
- Some hardware failures are detected by Remote Ops (Hi-Track) Monitor, and a Simple Trace is uploaded to the Remote Ops (Hi-Track) site automatically on some error conditions.
- Remote Ops (Hi-Track) Monitor v7.7 and greater now allows support to remotely request Simple Traces.

